
Simultaneous improvement of several traits
Most of the time, we want to select animals on more than one trait. For dairy cattle genetic selection focused on milk yields but also on contents of milk (fat and protein), reproduction and health. However, it can be really complex because those traits are not independent. The genetic dependence between traits is called genetic correlation, which defines the correlation between breeding values of two traits in the same individual. This genetic correlation can be positive or negative.
The following table gives some values for genetic correlation between traits of interest in the French Holstein population.
Traits | Fat content | Protein content | Conception rate for cows (%) |
|---|---|---|---|
Milk yield (kg) | -0.40 | -0.40 | -0.23 |
Fat content (g/kg) | 0.60 | 0.10 | |
Protein content (g/kg) | 0.10 |
As we can see that correlation between milk yield and protein content is negative, we can assume that choosing bulls for selection might be complex.
Let's illustrate this complexity. The following graph illustrates the distribution of EBV of dairy bulls on milk yield (kg/lactation) and protein content (g/kg). Each point represents an individual.
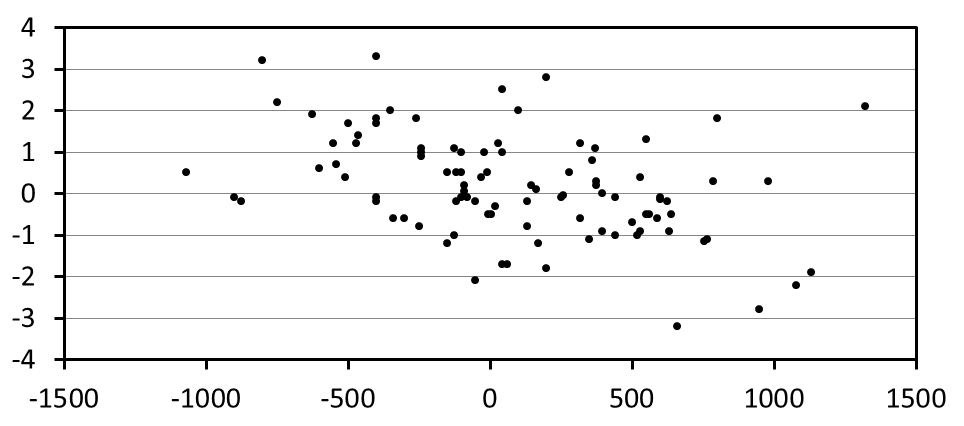
In this example, we have 40 candidates characterized by:
Milk | Protein content | |
|---|---|---|
1 | -750 | 2.2 |
2 | -540 | 0.7 |
3 | -500 | 1.7 |
4 | -465 | 1.4 |
5 | -400 | 1.7 |
6 | -400 | -0.2 |
7 | -340 | -0.6 |
8 | -300 | -0.6 |
9 | -250 | -0.8 |
10 | -240 | 1.1 |
11 | -240 | 0.9 |
12 | -150 | -1.2 |
13 | -125 | 1.1 |
14 | -90 | 0.2 |
15 | -90 | 0.05 |
16 | -80 | -0.1 |
17 | -50 | -0.2 |
18 | 30 | 1.2 |
19 | 45 | 2.5 |
20 | 45 | 1 |
21 | 100 | 2 |
22 | 370 | 1.1 |
23 | 395 | 0 |
24 | 395 | -0.9 |
25 | 500 | -0.7 |
26 | 530 | 0.4 |
27 | 550 | 1.3 |
28 | 550 | -0.5 |
29 | 560 | -0.5 |
30 | 600 | -0.1 |
31 | 590 | -0.6 |
32 | 625 | -0.2 |
33 | 755 | -1.15 |
34 | 765 | -1.1 |
35 | 800 | 1.8 |
36 | 1130 | -1.9 |
37 | 320 | 1.2 |
38 | 950 | -2.8 |
39 | 260 | -0.05 |
40 | 1080 | -2.2 |


